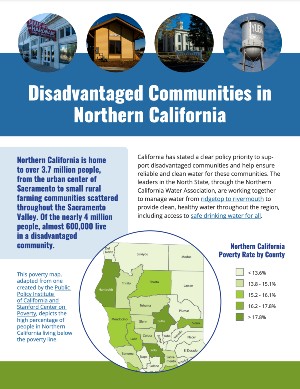
Northern California is home to over 3.7 million people, from the urban center of Sacramento to small rural farming communities scattered throughout the valley. Of the nearly 4 million people, almost 600,000 live in a disadvantaged community. NCWA and the leaders in the North State are working together to carry out a ridgetop to rivermouth approach to providing clean, healthy water throughout the region, including working to provide access to safe drinking water for all.
Poverty Map
The map below shows varying poverty levels throughout the state. This map was designed by the Public Policy Institute of California, in conjunction with the Stanford Center on Poverty and Inequality. Together, they created the California Poverty Measure, or CPM. The CPM uses, on average, $35,600 as the poverty line for a family of four while also adjusting for differences in cost of living and access to social safety net resources. The percentages refer to the amount of people living at or below the CPM.
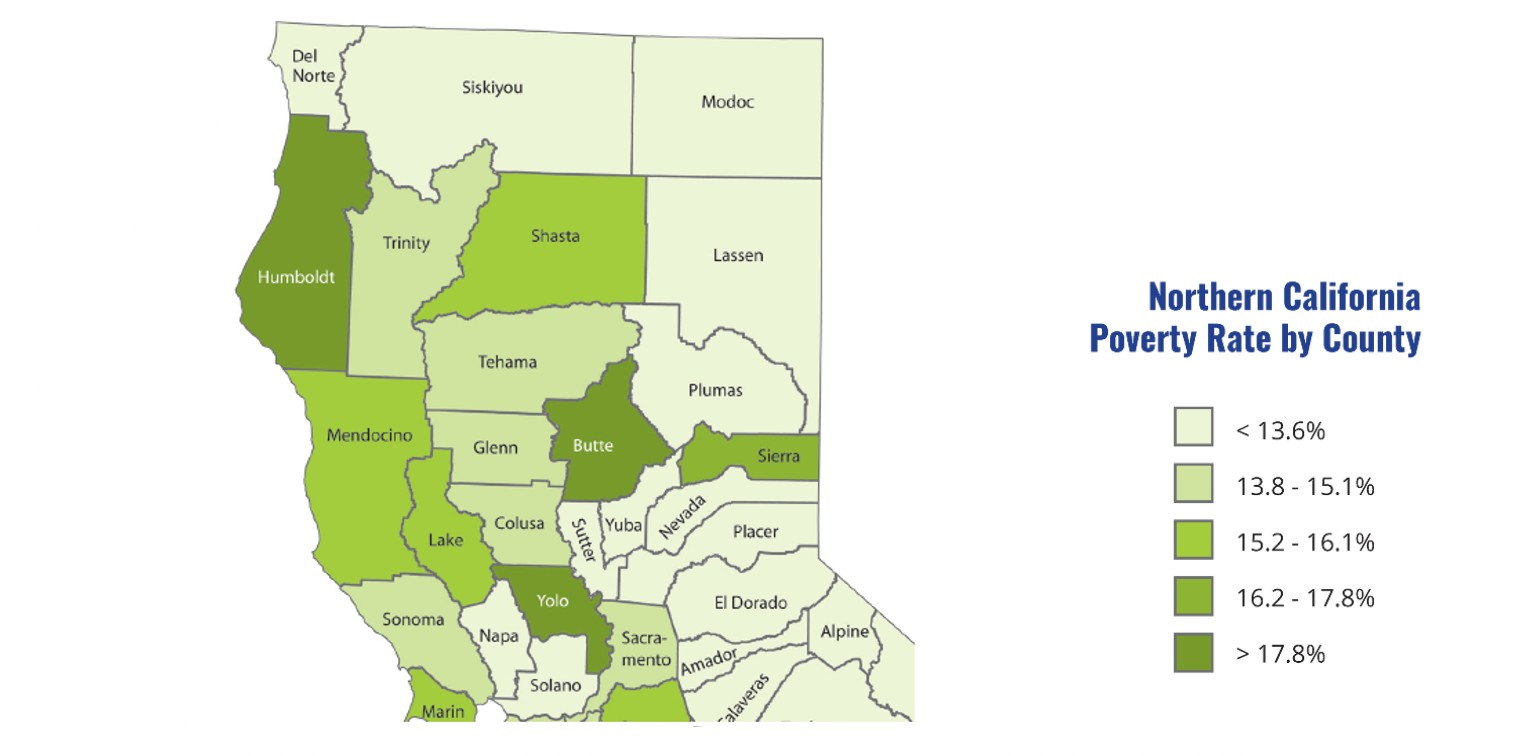
To learn more about poverty in California, click here.
What are Disadvantaged Communities?
A Disadvantaged Community (DAC) in California is defined in Water Code 79505.5 as a community with an annual median household income that is less than 80% of the Statewide annual median household income, or $56,982. A Severely Disadvantaged Community is defined by MHI below 60% of the statewide average, or $43,737. A Small Disadvantaged Community refers to a Disadvantaged Community that has a yearlong population of no more than 10,000 persons.
Where are Disadvantaged Communities?
The Department of Water Resources created a DAC Mapping Tool shown below. This interactive map identifies Disadvantaged Communities and can be clicked on and filtered by Census Place, Census Tract, Block Groups, Prop 1 Funding, Hydrologic Regions, and IRWM Regions. Click HERE to use the map.
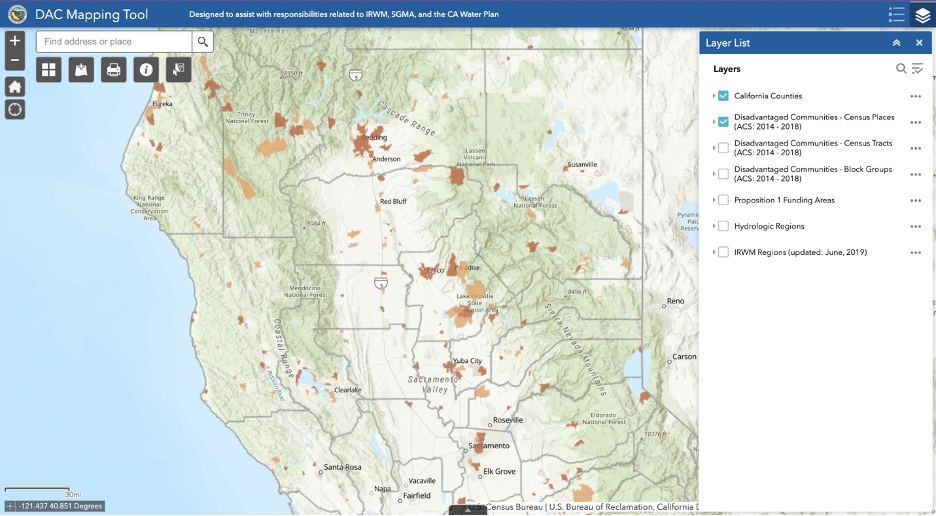
Using the DWR Mapping Tool, the following are a list of DACs in Northern California, with the Severely Disadvantaged Communities highlighted:
Butte
Population: 208,209
Households: 83,879
Average MHI: 54,972
| Population | Households | MHI | |
|---|---|---|---|
| Chico | 208,309 | 83,879 | 54,972 |
| Paradise | 26,543 | 11,118 | 49,270 |
| Magalia | 12,671 | 5,054 | 47,236 |
| Concow | 743 | 327 | 40,994 |
| Yankee Hill | 301 | 156 | 41,538 |
| Berry Creek | 1,241 | 512 | 33,750 |
| Oroville | 19,040 | 6,204 | 34,712 |
| Oroville East | 7,368 | 2,958 | 51,600 |
| Palermo | 5,544 | 1,987 | 37,889 |
| South Oroville | 3,181 | 896 | 45,260 |
| Thermalito | 6,704 | 2,243 | 32,413 |
| Biggs | 2,323 | 680 | 52,727 |
| Gridley | 6,585 | 2,172 | 45,541 |
| Forbestown | 221 | 147 | 21,379 |
| Clipper Mills | 319 | 126 | 53,538 |
Colusa
Population: 21,917
Households: 7,329
Average MHI: 59,427
| Population | Households | MHI | |
|---|---|---|---|
| Princeton | 297 | 132 | 48,456 |
| Stonyford | 136 | 65 | 37,917 |
| Lodoga | 126 | 64 | 39,444 |
| Colusa | 5,902 | 2,119 | 41,726 |
| Grimes | 358 | 90 | 32,308 |
El Dorado
Population: 21,917
Households: 7,329
Average MHI: 59,427
| Population | Households | MHI | |
|---|---|---|---|
| South Lake Tahoe | 21,814 | 8,706 | 48,653 |
| Pollock Pines | 6,905 | 2,640 | 51,875 |
| Grizzly Flats | 1,087 | 451 | 49,981 |
Glenn
Population: 28,805
Households: 10,216
Average MHI: 51,682
| Population | Households | MHI | |
|---|---|---|---|
| Hamilton City | 2,224 | 682 | 48,125 |
| Orland | 7,541 | 2,539 | 43,915 |
| Artois | 292 | 110 | 41,300 |
| Willows | 6,022 | 2,281 | 44,275 |
| Elk Creek | 191 | 77 | 47,596 |
Lassen
Population: 33,159
Households: 9,172
Average MHI: 56,971
| Population | Households | MHI | |
|---|---|---|---|
| Bieber | 178 | 86 | 47,727 |
| Spaulding | 110 | 86 | 49,643 |
| Susanville | 15,216 | 3,029 | 51,327 |
| Patton Village | 604 | 289 | 48,319 |
| Westwood | 1,545 | 774 | 44,947 |
Nevada
Population: 103,487
Households: 40,917
Average MHI: 68,333
| Population | Households | MHI | |
|---|---|---|---|
| Penn Valley | 1,424 | 560 | 43,340 |
| Grass Valley | 12,932 | 5,992 | 35,662 |
| Nevada City | 3,128 | 1,469 | 43,098 |
Placer
Population: 412,300
Households: 145,714
Average MHI: 93,677
| Population | Households | MHI | |
|---|---|---|---|
| Kings Beach | 2,833 | 1,189 | 45,208 |
| Carnelian Bay | 463 | 222 | 52,727 |
| Dutch Flat | 196 | 112 | 45,227 |
| Colfax | 2,029 | 868 | 49,571 |
| Foresthill | 1,546 | 645 | 52,520 |
| Newcastle | 1,167 | 581 | 52,656 |
| Sheridan | 1,250 | 406 | 42,278 |
Plumas
Population: 19,915
Households: 8,332
Average MHI: 57,233
| Population | Households | MHI | |
|---|---|---|---|
| Chester CDP | 2,116 | 955 | 54,583 |
| East Shore | 169 | 74 | 51,000 |
| Greenville | 1,108 | 460 | 31,630 |
| Keddie | 41 | 17 | 49,135 |
| East Quincy | 2,622 | 1,030 | 46,538 |
| Quincy | 1,895 | 703 | 50,250 |
| Greenhorn | 254 | 109 | 55,078 |
| Mabie CDP | 74 | 43 | 56,250 |
| Portola | 1,912 | 822 | 41,053 |
| Chilcoot-Vinton | 147 | 131 | 40,938 |
Shasta
Population: 182,139
Households: 70,845
Average MHI: 57,139
| Population | Households | MHI | |
|---|---|---|---|
| Fall River Mills | 273 | 139 | 40,885 |
| Burney | 3,807 | 1,324 | 40,119 |
| Big Bend | 96 | 45 | 15,750 |
| Montgomery Creek | 61 | 45 | 27,125 |
| Round Mountain | 112 | 57 | 40,417 |
| Shingletown | 2,272 | 969 | 45,609 |
| Cottonwood | 3,289 | 1,244 | 34,167 |
| Anderson | 10,265 | 3,964 | 38,915 |
| Redding | 91,327 | 36,347 | 50,579 |
| Bella Vista | 2,614 | 969 | 55,234 |
| Shasta Lake | 10,142 | 3,767 | 51,836 |
| Keswick | 430 | 169 | 42,250 |
| Mountain Gate | 794 | 370 | 33,125 |
| Lakehead | 617 | 250 | 45,156 |
| French Gulf | 441 | 187 | 42,917 |
Sierra
Population: 3,283
Households: 1,250
Average MHI: 52,103
| Population | Households | MHI | |
|---|---|---|---|
| Loyalton | 1,149 | 322 | 42,500 |
| Downieville | 114 | 86 | 21,250 |
| Pike | 167 | 28 | 46,667 |
Sutter
Population: 99,063
Households: 32,586
Average MHI: 63,502
| Population | Households | MHI | |
|---|---|---|---|
| Robbins | 321 | 112 | 48,750 |
| Meridian | 405 | 158 | 48,333 |
| Live Oak | 8,622 | 2,444 | 51,597 |
| Yuba City | 66,388 | 22,572 | 54,406 |
Tehama
Population: 65,498
Households: 24,661
Average MHI: 48,895
| Population | Households | MHI | |
|---|---|---|---|
| Paskenta | 105 | 45 | 40,179 |
| Flournoy | 171 | 55 | 41,806 |
| Rancho Tehama Reserve | 1,922 | 630 | 30,395 |
| Corning | 7,535 | 2,537 | 32,219 |
| Richfield | 272 | 93 | 46,250 |
| Vina | 210 | 86 | 40,455 |
| Los Molinos | 1,845 | 746 | 40,909 |
| Tehama | 445 | 191 | 43,906 |
| Gerber | 1,259 | 451 | 43,319 |
| Red Bluff | 14,132 | 5,597 | 31,065 |
| Bend | 457 | 202 | 36,944 |
| Lake California | 3,281 | 1,194 | 54,444 |
| Paynes Creek | 53 | 35 | 36,518 |
| Manton | 372 | 145 | 38,594 |
| Mineral | 292 | 118 | 49,625 |
Yolo
Population: 216,986
Households: 74,614
Average MHI: 73,746
| Population | Households | MHI | |
|---|---|---|---|
| Dunnigan | 1,278 | 473/td> | 47,888 |
| Knights Landing | 869 | 289 | 39,861 |
| University of California, Davis | 7,379 | 1,003 | 27,824 |
Yuba
Population: 83,421
Households: 26,434
Average MHI: 59,424
| Population | Households | MHI | |
|---|---|---|---|
| Marysville | 12,282 | 4,592/td> | 47,448 |
| Linda | 19,314 | 6,506 | 39,886 |
| Olivehurst | 13,309 | 4,382 | 44,298 |
| Beale AFB | 1,039 | 338 | 45,667 |
| Smartsville | 163 | 67 | 27,011 |
| Challenge-Brownsville | 864 | 401 | 56,518 |
What programs are available to help DACs?
California and the Sacramento Valley experienced dry years from 2012-2016, with the years 2014 and 2015 challenging the region like never before. Water resources managers worked hard through these challenging years with many of our partners to serve water for multiple beneficial uses.
The North State Drinking Water Solutions Network
Water Quality Coalitions to Ensure High Quality Water
– Sacramento Valley Water Quality Coalition
– California Rice Commission
The Voluntary Agreement Process for Healthy Rivers, Landscapes, Communities and Farms
Sustainable Groundwater Management (SGMA)
Ensuring Access to Safe Drinking Water For All Communities: Resources Available to Assist Local Communities with Water Shortages
Safe and Affordable Funding for Equity and Resilience (SAFER)
California Water Plan
Integrated Regional Water Management
Low Income Household Water Assistance Program (Federal)


