The 2018 Annual Monitoring Report (Monitoring Report) submitted on May 1, 2019 to the Central Valley Regional Water Quality Control Board (Regional Water Board) by the Sacramento Valley Water Quality Coalition (Coalition) shows a continuing trend of excellent water quality. The Report characterizes potential water quality impacts of agricultural drainage from a broad geographic area in the Sacramento Valley from October 2017 through September 2018, as part of the Regional Water Board’s Irrigated Lands Regulatory Program (ILRP). The goal of the Coalitions in the Sacramento Valley is to protect multiple beneficial uses, including aquatic species, drinking water and agriculture.
Since the inception of the ILRP in 2003, a total of 151 Coalition monitoring events have been completed, with additional monitoring data collected by coordinating programs and for follow-up evaluations. Almost 98.4% of all pesticide analyses performed for the Coalition over the course of its monitoring history have been below detection in the professional laboratory. For context, detection is a measured concentration above laboratory detection limits in an ambient water quality sample. An exceedance is a measured concentration that is greater than either a numeric or narrative water quality objective established in the Central Valley Basin Plan. As an example, glyphosate, one of the most widely used agricultural pesticides, has been detected in only 8 samples in 14 years of monitoring (2.4% detection) and has never approached concentrations likely to cause toxicity to sensitive species.
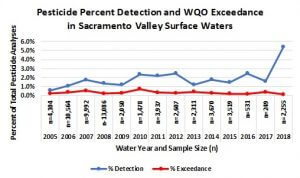
For the period of record covered by this Report, samples were collected for 10 scheduled monthly events and 2 wet weather (“storm”) events. Pesticides were infrequently detected (≈5.4% of all pesticide results collected in 2018 were for detected concentrations), and when detected rarely exceeded applicable objectives (0.13% exceedance). The time series plot below of pesticide percent detections and exceedances in Sacramento Valley surface waters for Water Years 2005 – 2018 shows a reduction in the number of exceedances of water quality objectives. The increase in detections shown in 2017 is due to a significant increase in the number of individual pesticides analyzed by the Coalition’s monitoring program starting in 2017, along with more sophisticated analytical methods and a laboratory’s ability to detect pesticides at lower levels. Most importantly, during this same time the number of exceedances was reduced, showing the objectives are being met.
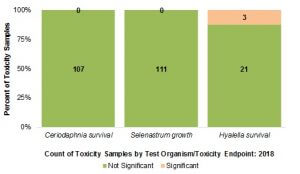
More specifically, as shown below, the Coalition has also conducted ambient toxicity monitoring in the water column (water flea (Ceriodaphnia dubia), green algae (Selenastrum capricornutum)) and sediment (amphipod (Hyalella azteca)). As shown by the top bar chart below, no toxicity in the water column was found in any of the 218 total analyses for Ceriodaphnia and Selenastrum during the 2018 Water Year. Toxicity in sediment was limited to three samples observed to be toxic to Hyalella. Importantly, because the Hyallela survival results were in the higher end of the statistically significant range, they did not require any further analysis of toxicity.
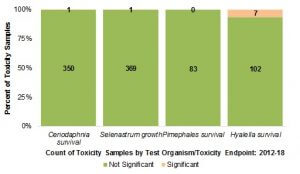
The bottom bar chart shows that toxicity was rarely found in the water column during the period 2012 – 2018 (for the last seven years, only 0.3% of samples have shown toxicity). During the same seven years, only 7% of sediment samples showed toxicity. The Coalition last tested for water column toxicity to fathead minnow (Pimephales sp.) in 2015.
These consistent, year-after-year results can be attributed to the continued commitment by Coalition members to implement management and cultural practices targeted specifically at improving water quality in the Sacramento Valley. Annually, the Coalition spends nearly $2 million on surface water quality monitoring, member education, and implementation of Management Plan actions to address water quality improvements by agriculture. In recent years, the Coalition has spent close to $500,000 to develop and begin implementation of a groundwater monitoring program and member reporting related to critical Member reporting on nitrogen usage that will serve as a foundational element for the protection of groundwater quality in the Sacramento Valley.
Additionally, as documented by the Regional Water Board in the Coalition’s Waste Discharge Requirements (WDR) Order, the Coalition’s thirteen subwatersheds have secured nearly $25 million in Natural Resource Conservation Service (NRCS) cost-sharing program funding, water quality funding from Propositions 50 and 84, plus Clean Water Act Section 319(h) grant funding administered by the State Water Resources Control Board (SWRCB). These funds have assisted the more than 8,000 owners and operators of irrigated lands enrolled in the Coalition to implement practices that reduce nutrient, sediment, and pesticide loads to waterways.
The Coalition’s Report is available at www.svwqc.org or by contacting Bruce Houdesheldt, Director Water Quality, Northern California Water Association.
The Sacramento Valley Water Quality Coalition (Coalition) was formed in 2003 to enhance and improve water quality in the Sacramento Valley, while sustaining the economic viability of agriculture, functional values of managed wetlands, and sources of safe drinking water. The Coalition is comprised of more than 8,600 farmers and wetlands managers and encompasses more than 1.3 million irrigated acres, and is supported by more than 200 agricultural representatives, natural resource professionals, and local governments throughout the region who are dedicated to improve water quality for Northern California farms, cities, and the environment.


Super you’re not killing things, now we can focus on fully supporting beneficial uses in each sub-watershed!
How about those nutrients levels and DO!?!
Thank you for making progress